How To Identify Fast Selling Items In The Fashion Market
Understanding high-demand fashion items is crucial for staying ahead of trends and optimizing inventory. By leveraging tools like Woven Insights, you can analyze replenishment patterns to identify high-demand products.

Understanding which items are selling quickly in the fashion industry is crucial for staying ahead of trends and optimizing inventory. By leveraging tools like Woven Insights, you can analyze replenishment patterns to identify high-demand products.
How To Identify Fast-Selling Products In The Fashion Market Using Woven Insights
Here’s a 6-step guide to identify the most in-demand items in a particular fashion market segment:
Step 1: Set Your Market and Category
Begin by narrowing your focus to a specific geographic market (e.g., the United Kingdom - GB) and a product category (e.g., dresses).
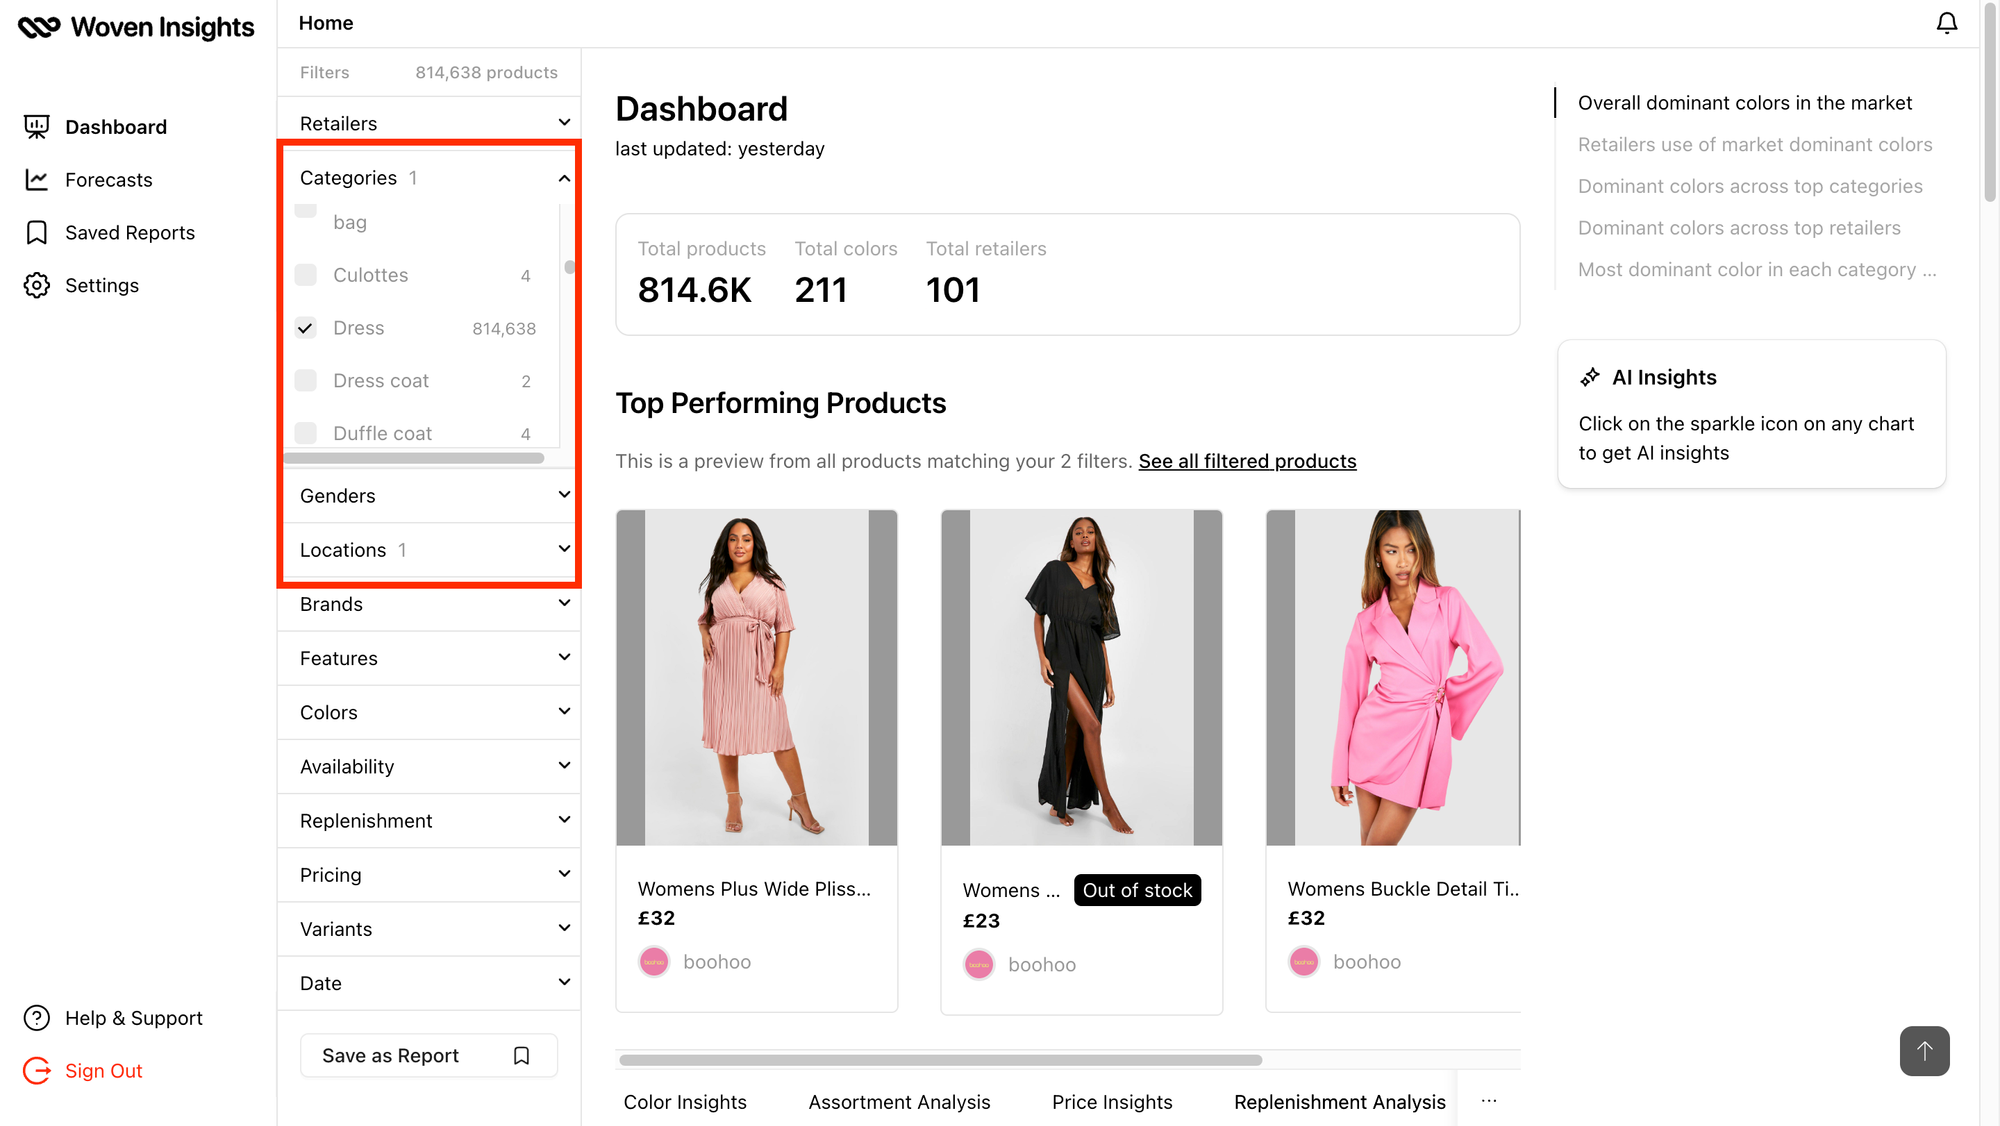
This ensures your analysis is targeted and relevant. For example, selecting “dress” allows you to drill down into trends within the dress segment of the fashion market.
Step 2: Access Replenishment Analysis
Navigate to the Replenishment Analysis section of your tool.
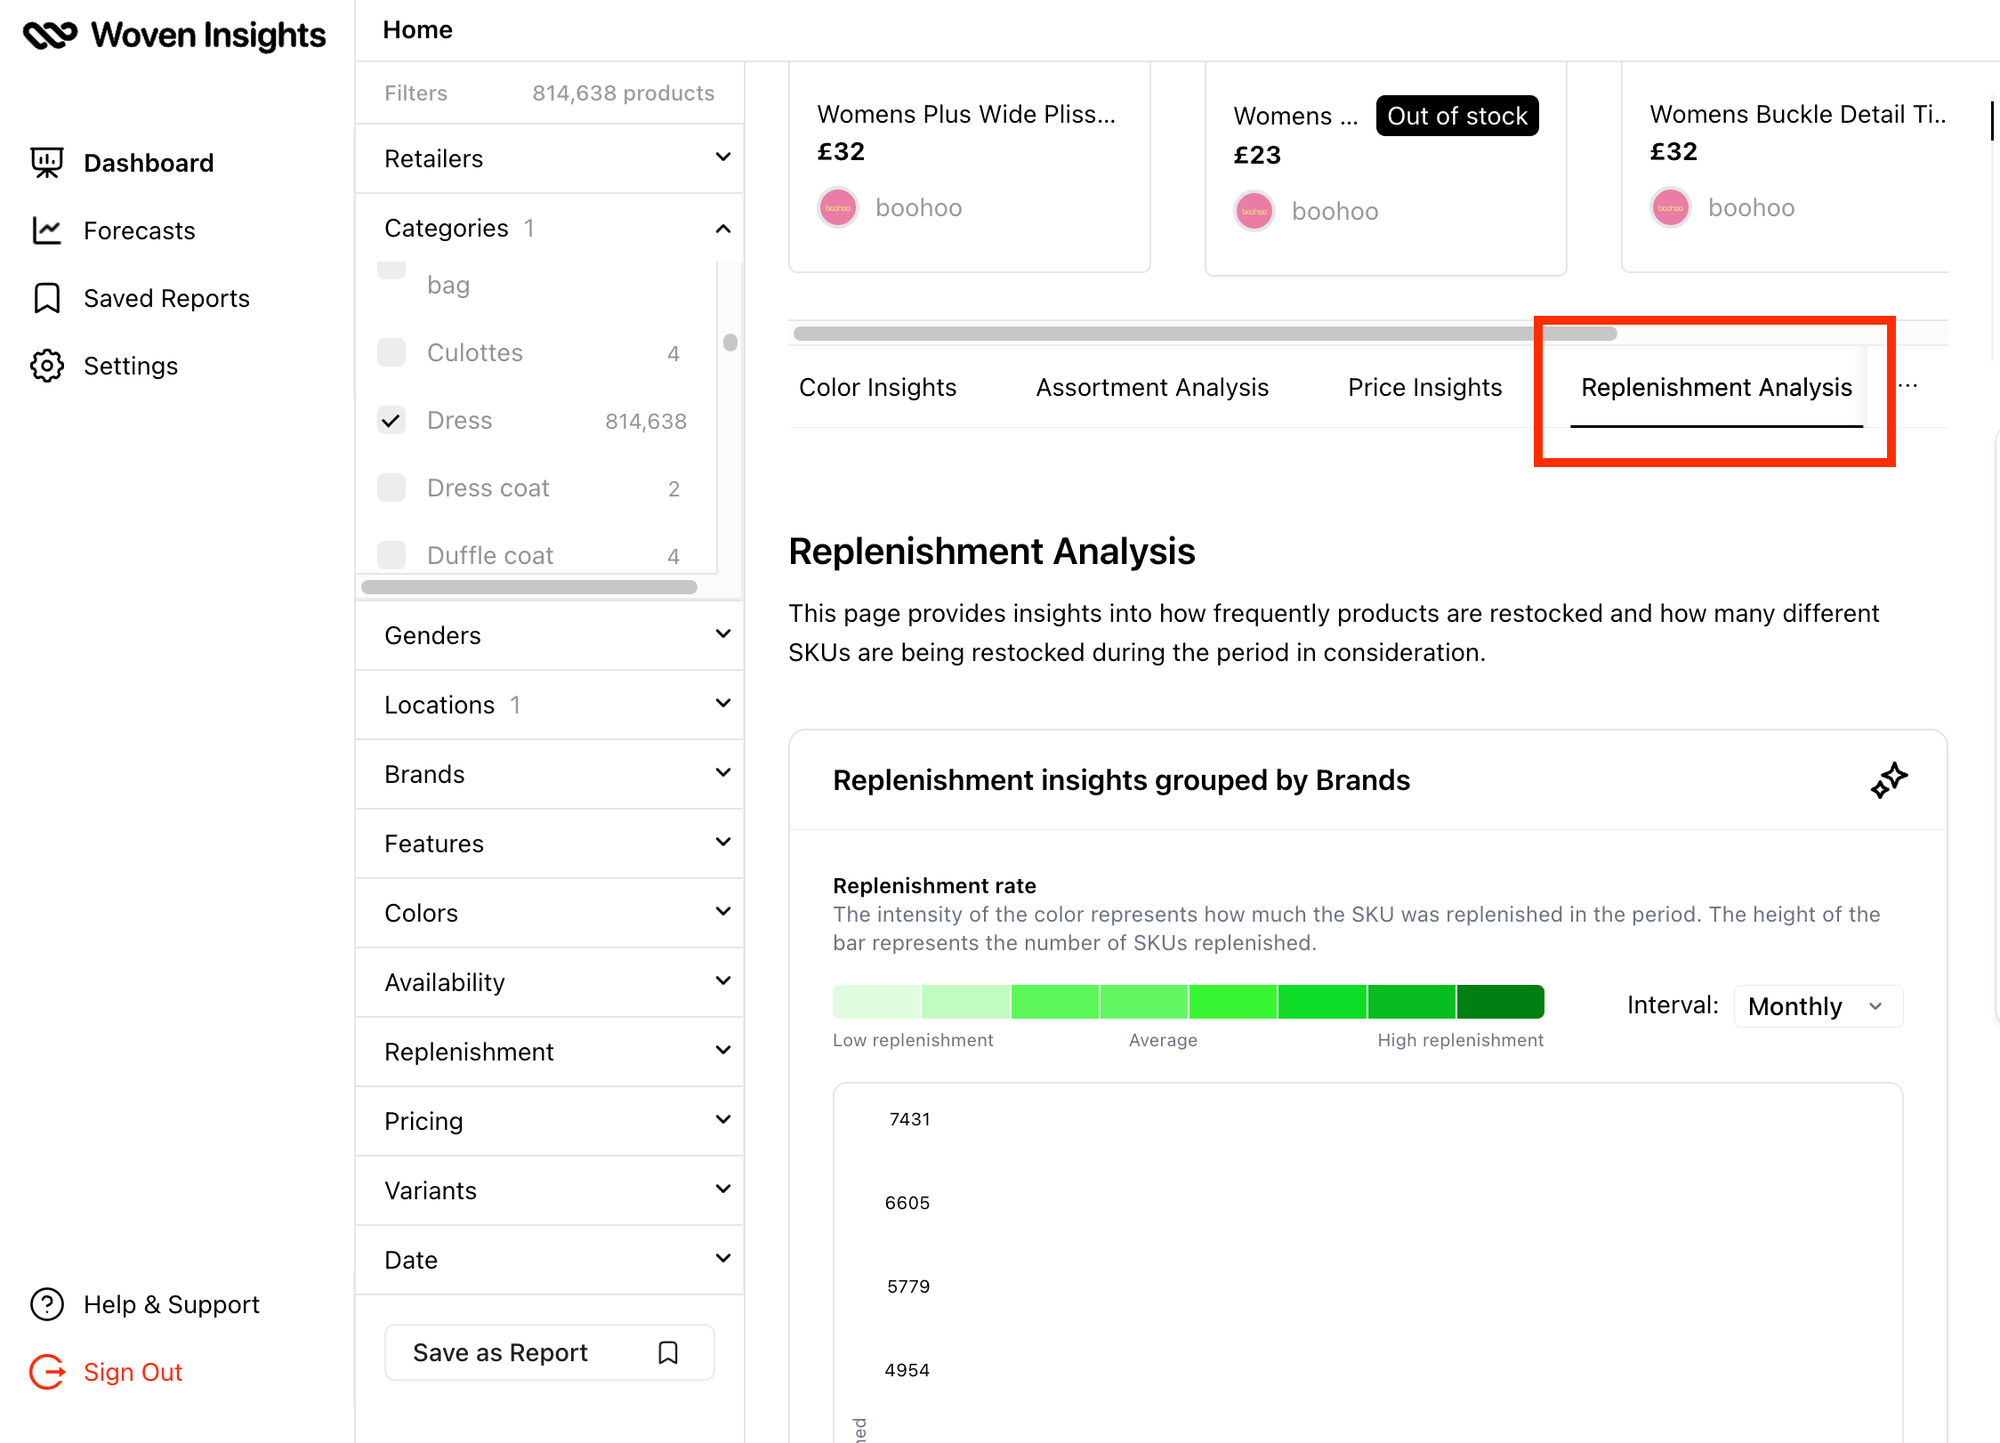
This feature tracks how often items are restocked—a key indicator of fast-selling products. Replenishment Rates signal high consumer demand, as retailers replenish sold-out inventory to meet sales.
Step 3: Interpret Brand Replenishment Data
The tool displays a chart with vertical bars representing brands.
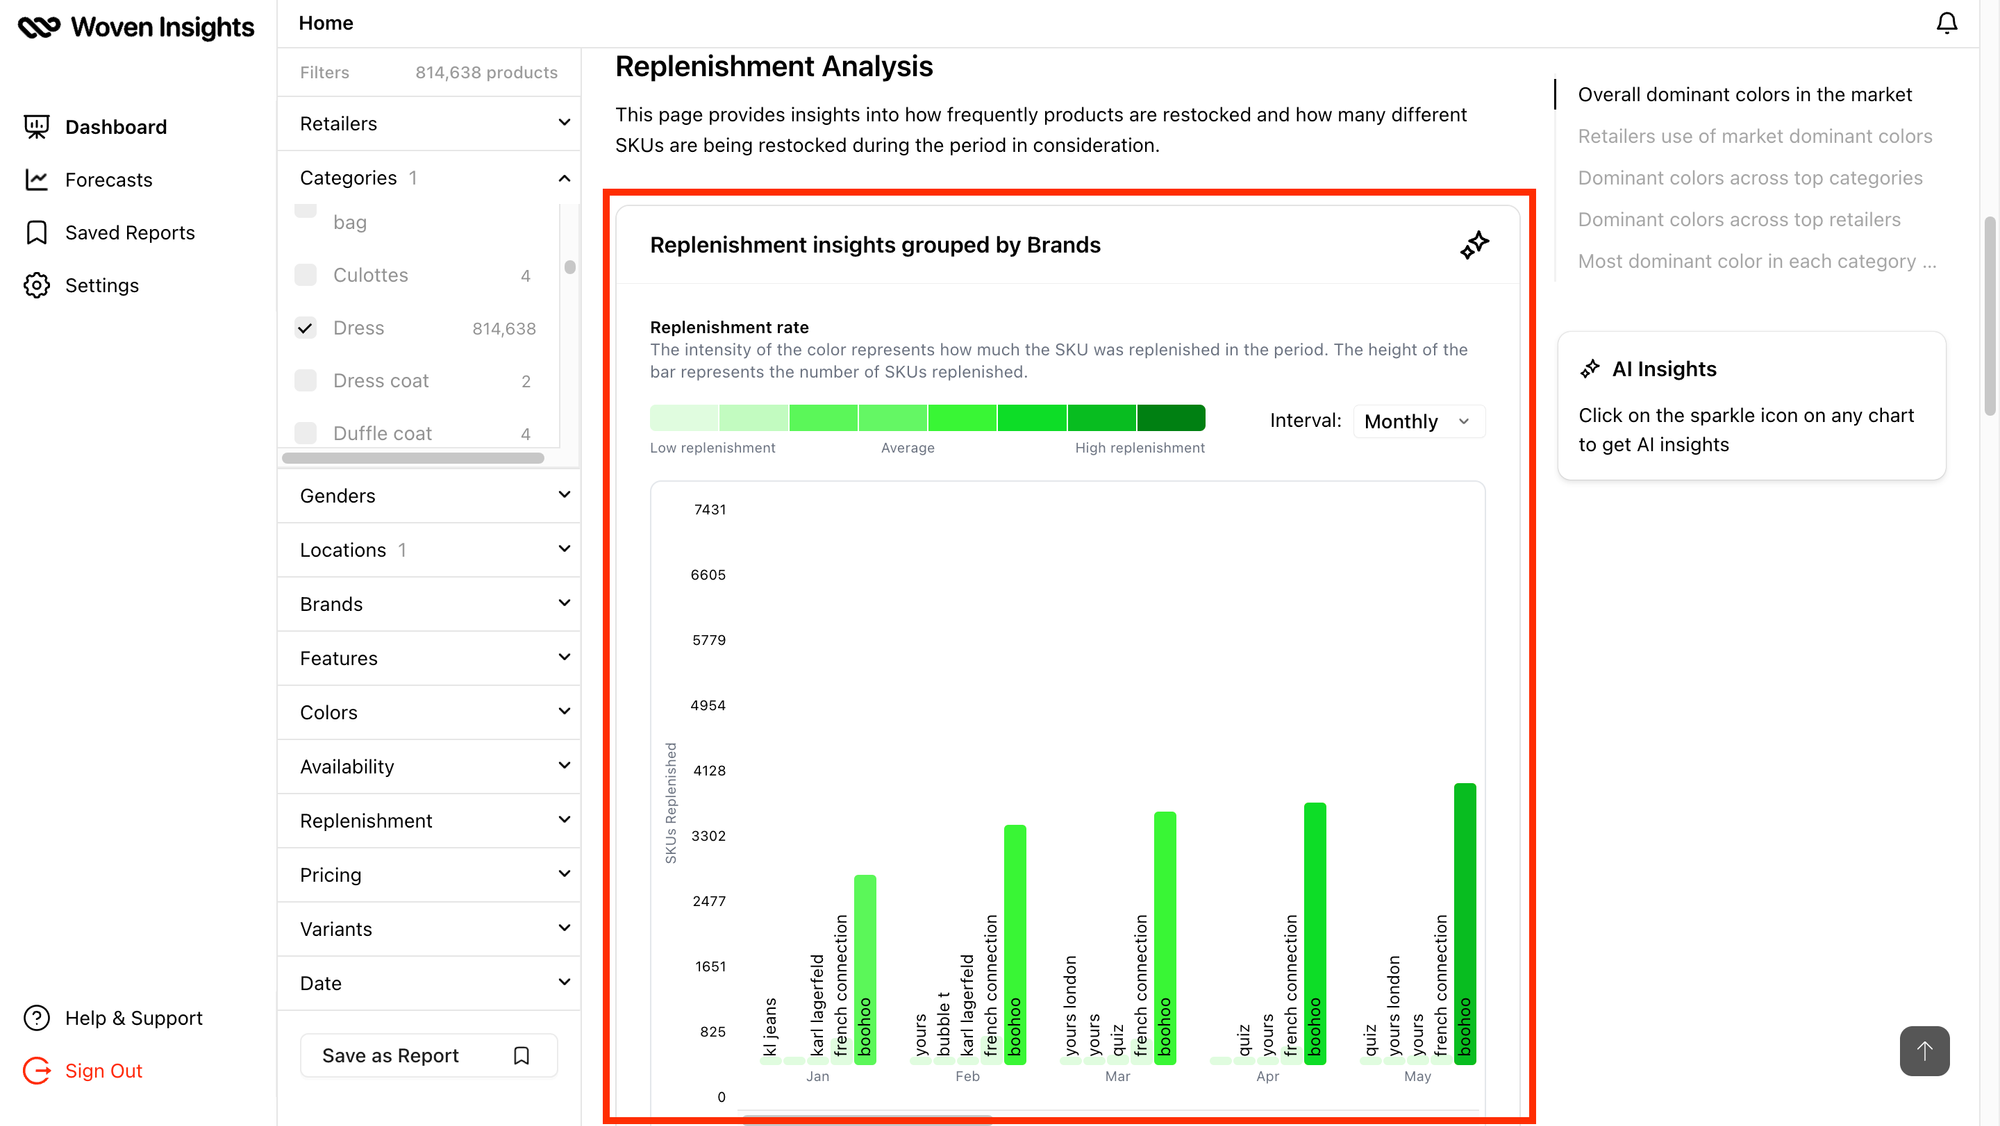
Here’s how to decode the data:
- Bar Height: Indicates the number of SKUs (unique products) a brand has in the selected category. A taller bar means more products are being replenished.
Example: Boohoo’s prominent bar height indicates a high level of replenishment activity (meaning higher demand) in the dress category, compared to other brands. - Color Intensity: Reflects replenishment frequency. More intense colors mean higher restocking activity, signaling strong sales.

Step 4: Adjust the Date Range for Temporal Insights
Switch the view to monthly to track trends over time.
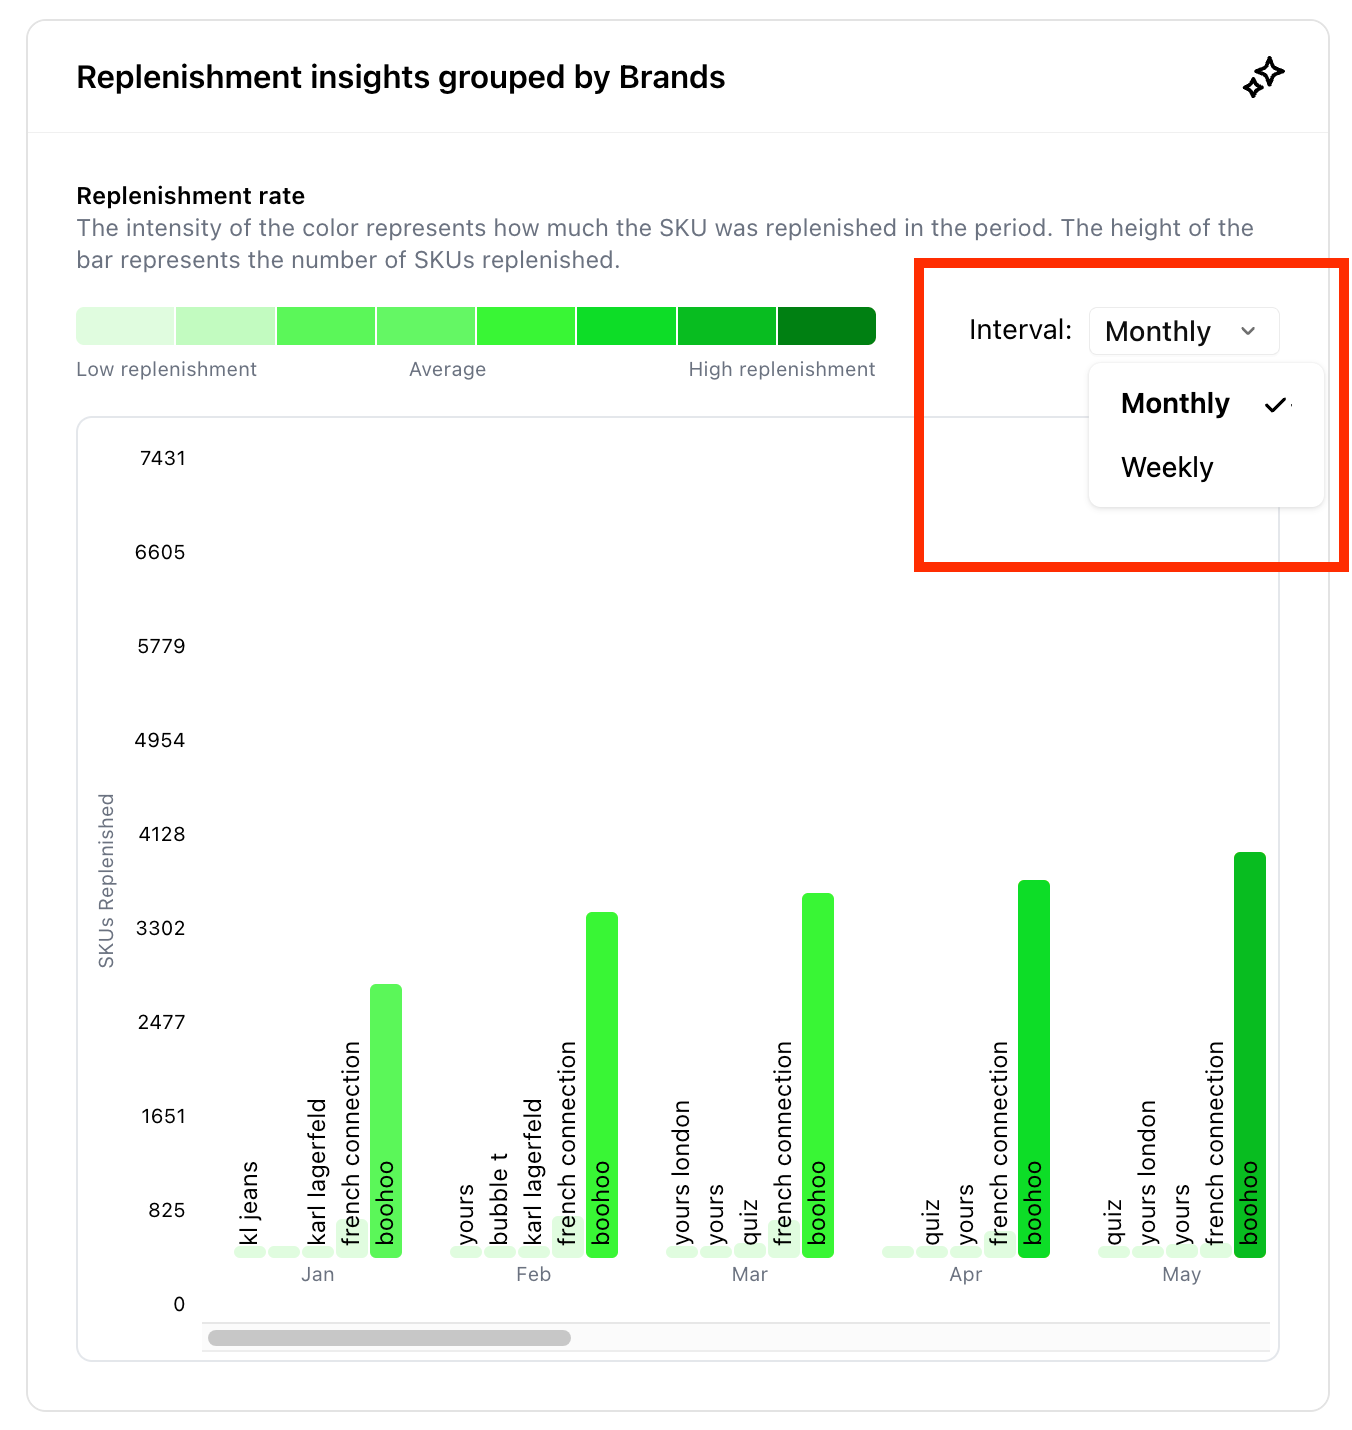
This reveals seasonal patterns or emerging demand. For instance, noticing replenishment spikes in February for dresses could indicate pre-spring collections gaining traction.
Step 5: Analyze Color Trends
Scroll down to the chart view to "Replenishment Insights Grouped By Categories", similarly to Brand Analysis.
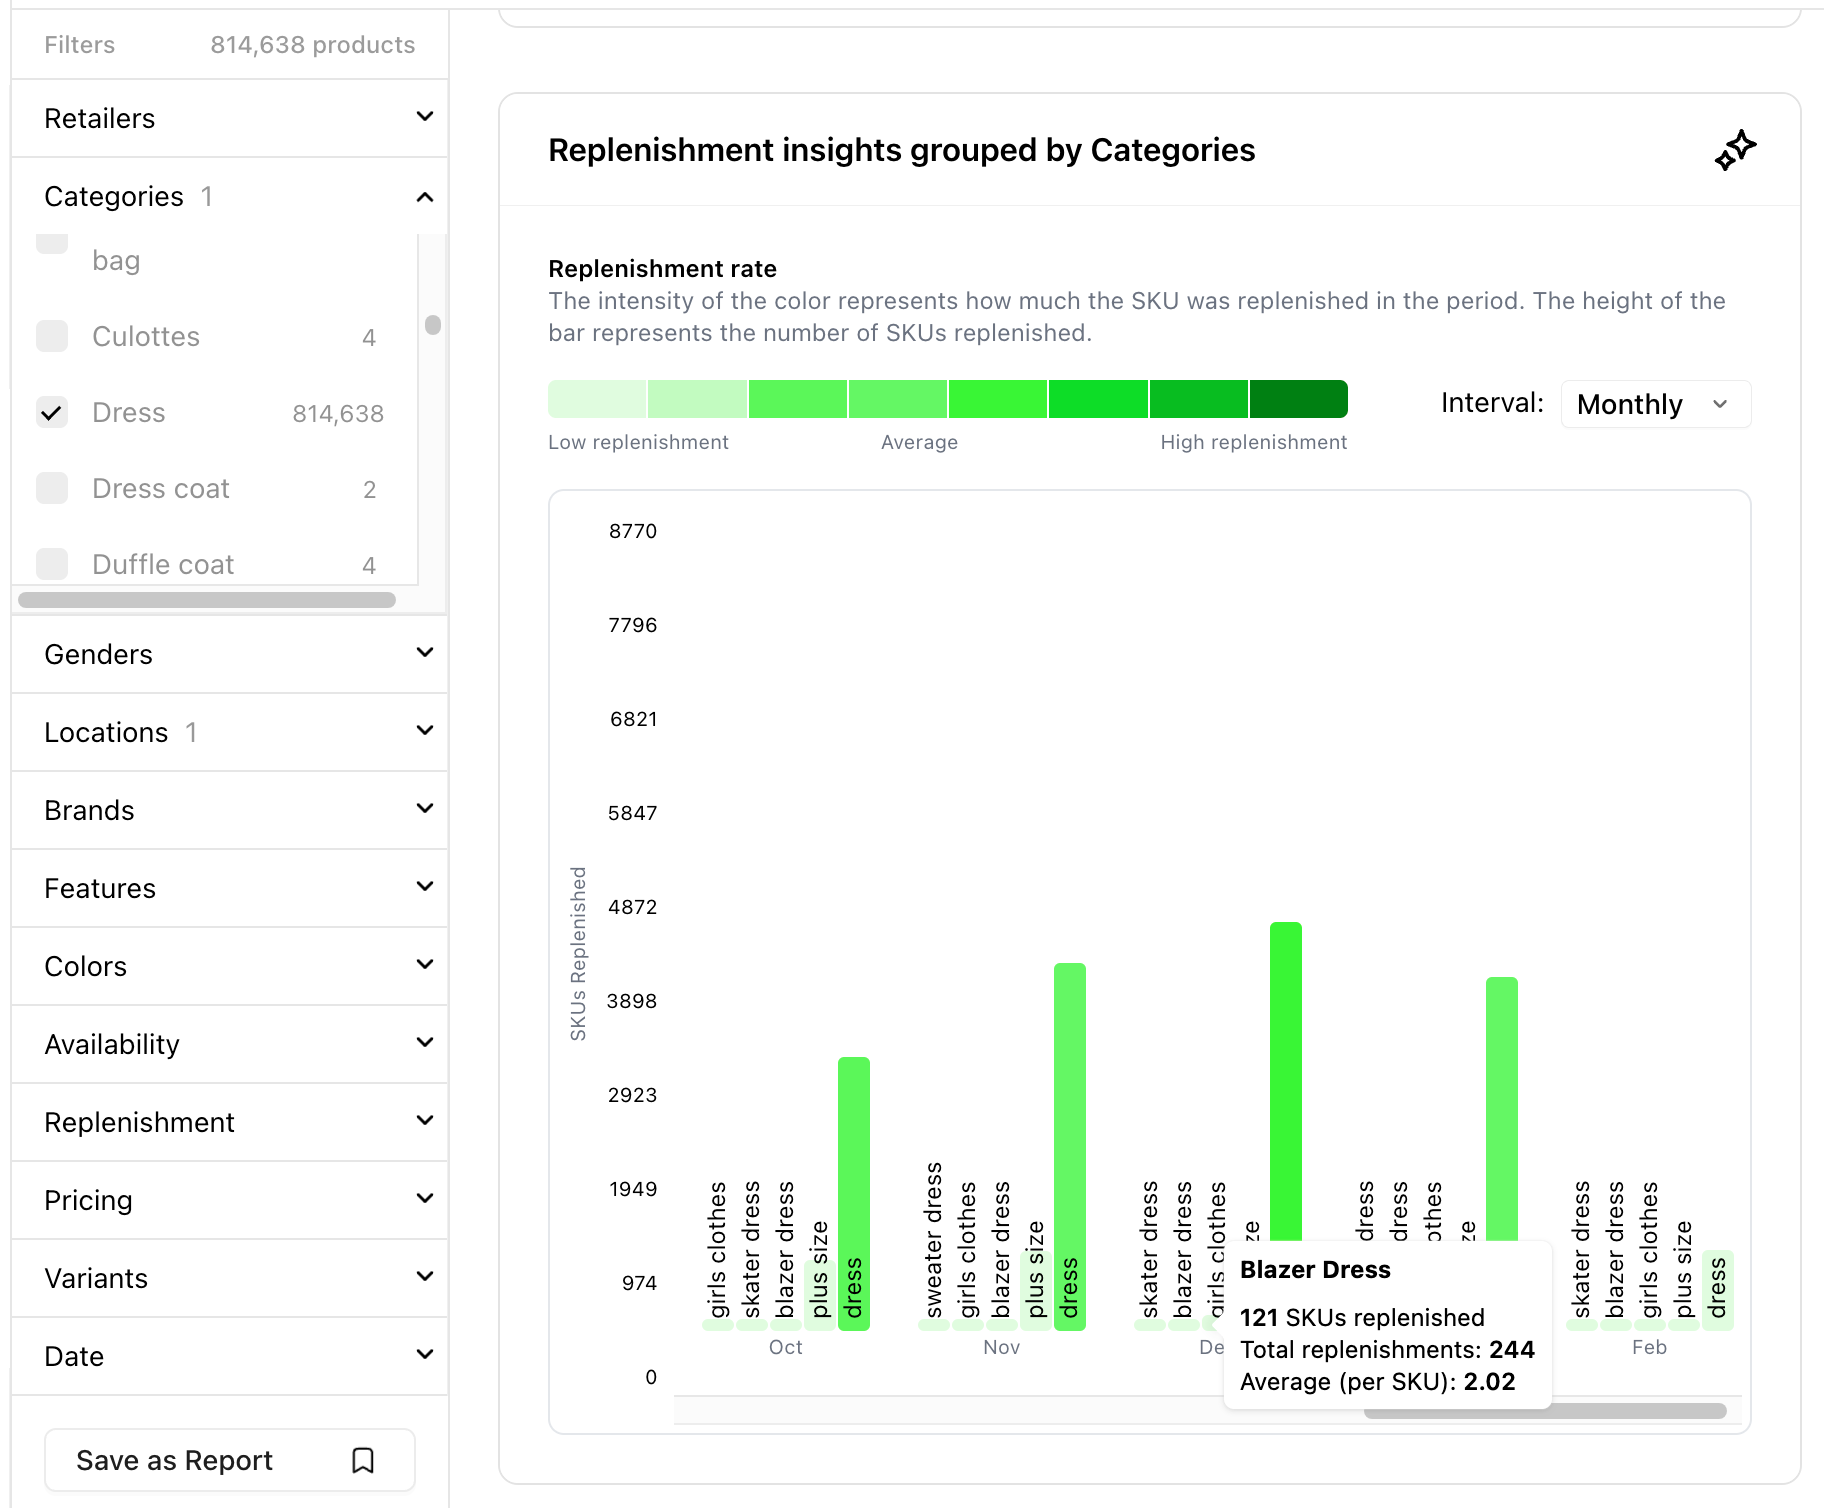
Here’s how to decode the data:
- Bar Height: Indicates the number of SKUs (unique products) across various sub-categories in the selected category. A taller bar means more products in that sub-category are being replenished.
Example: Plus-Size and Blazer Dresses prominent bar heights indicate a high level of replenishment activity (meaning higher demand) in the those sub-categories, compared to others. - Color Intensity: Reflects replenishment frequency. More intense colors mean higher restocking activity, signaling strong sales.
Step 5: Analyze Color Trends
Scroll down to the chart viewing colors to identify popular shades.
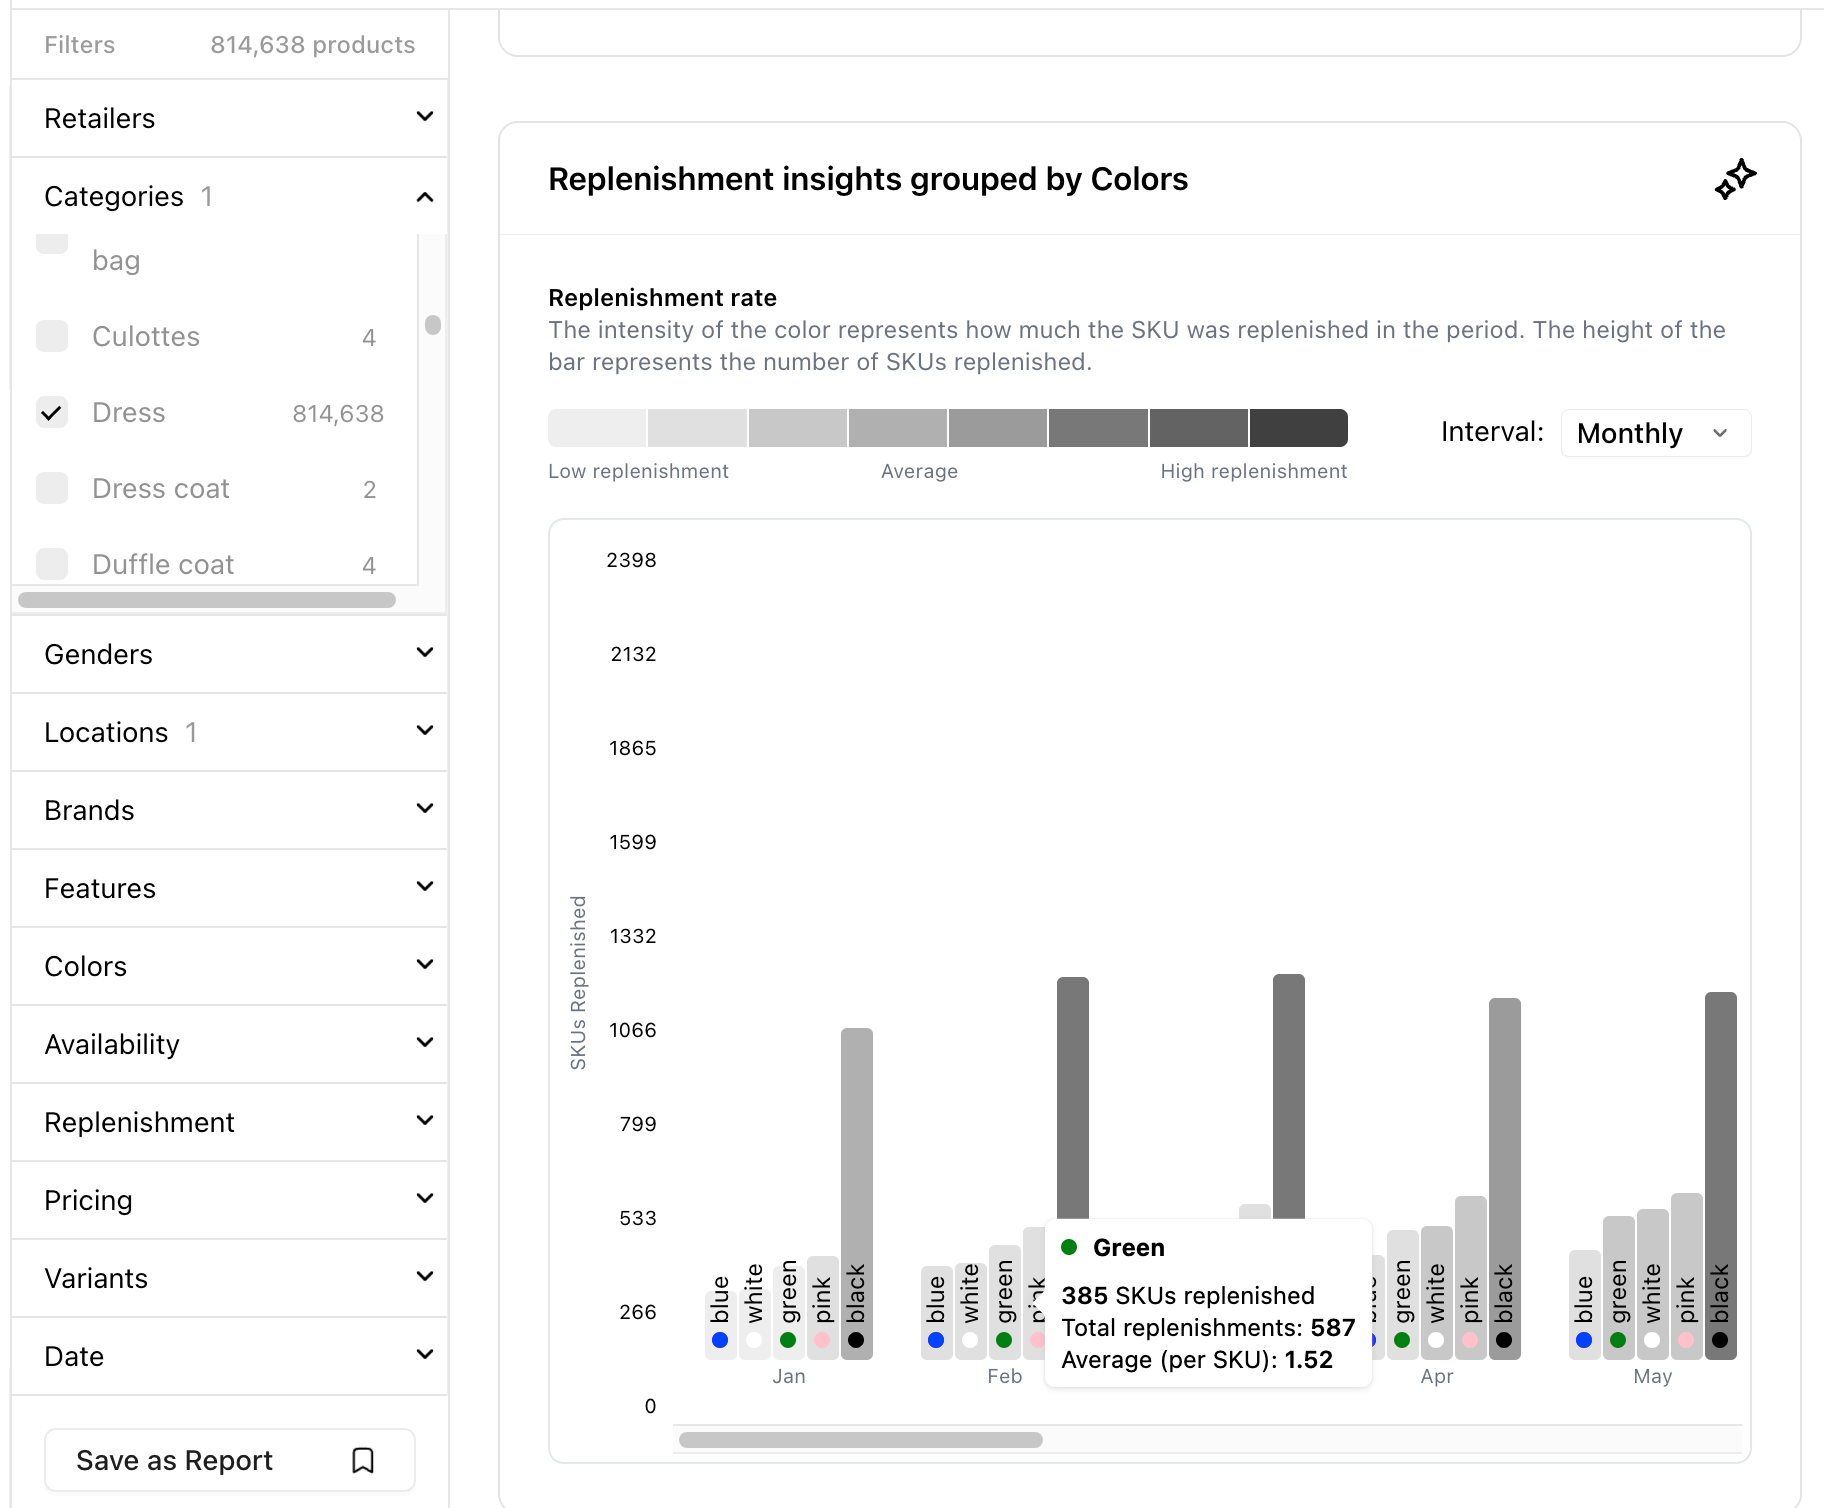
Here’s how to decode the data:
- Bar Height: Shows how many SKUs with that color are replenished.
- Color Intensity: Highlights which shades are restocked most.
Example: Black and Pink dresses dominate consistently with the tallest bar, indicating high sales and restocking rates.
Step 6: Compare Across Retailers and Categories
While the video demo above focuses on dresses, you can apply this method to other categories (e.g., activewear, footwear) or compare multiple retailers. This helps identify broader trends or niche opportunities.
Conclusion: Turn Data Into Strategy
By analyzing replenishment patterns, brands and retailers can:
- Stock smarter: Prioritize high-replenishment items like black dresses to meet consumer demand and increase profits.
- Spot trends: Early signals (e.g., rising red dress sales in December) inform product development, inventory and marketing.
- Optimize inventory: Reduce overstock by focusing on items with proven demand.
- Analyze Competitors: Identify fast moving colours, categories, features in competitor products and decode how they address the demand.
Regularly revisiting this analysis ensures you stay aligned with consumer behavior and market shifts. With tools like Woven Insights, data-driven decisions literally are a competitive edge in the fast-paced fashion industry.
Click on the button below for a Woven Insights demo