Nike vs Lululemon Price Analysis 2025: Price Range, Top Price Points, and Distribution Trends


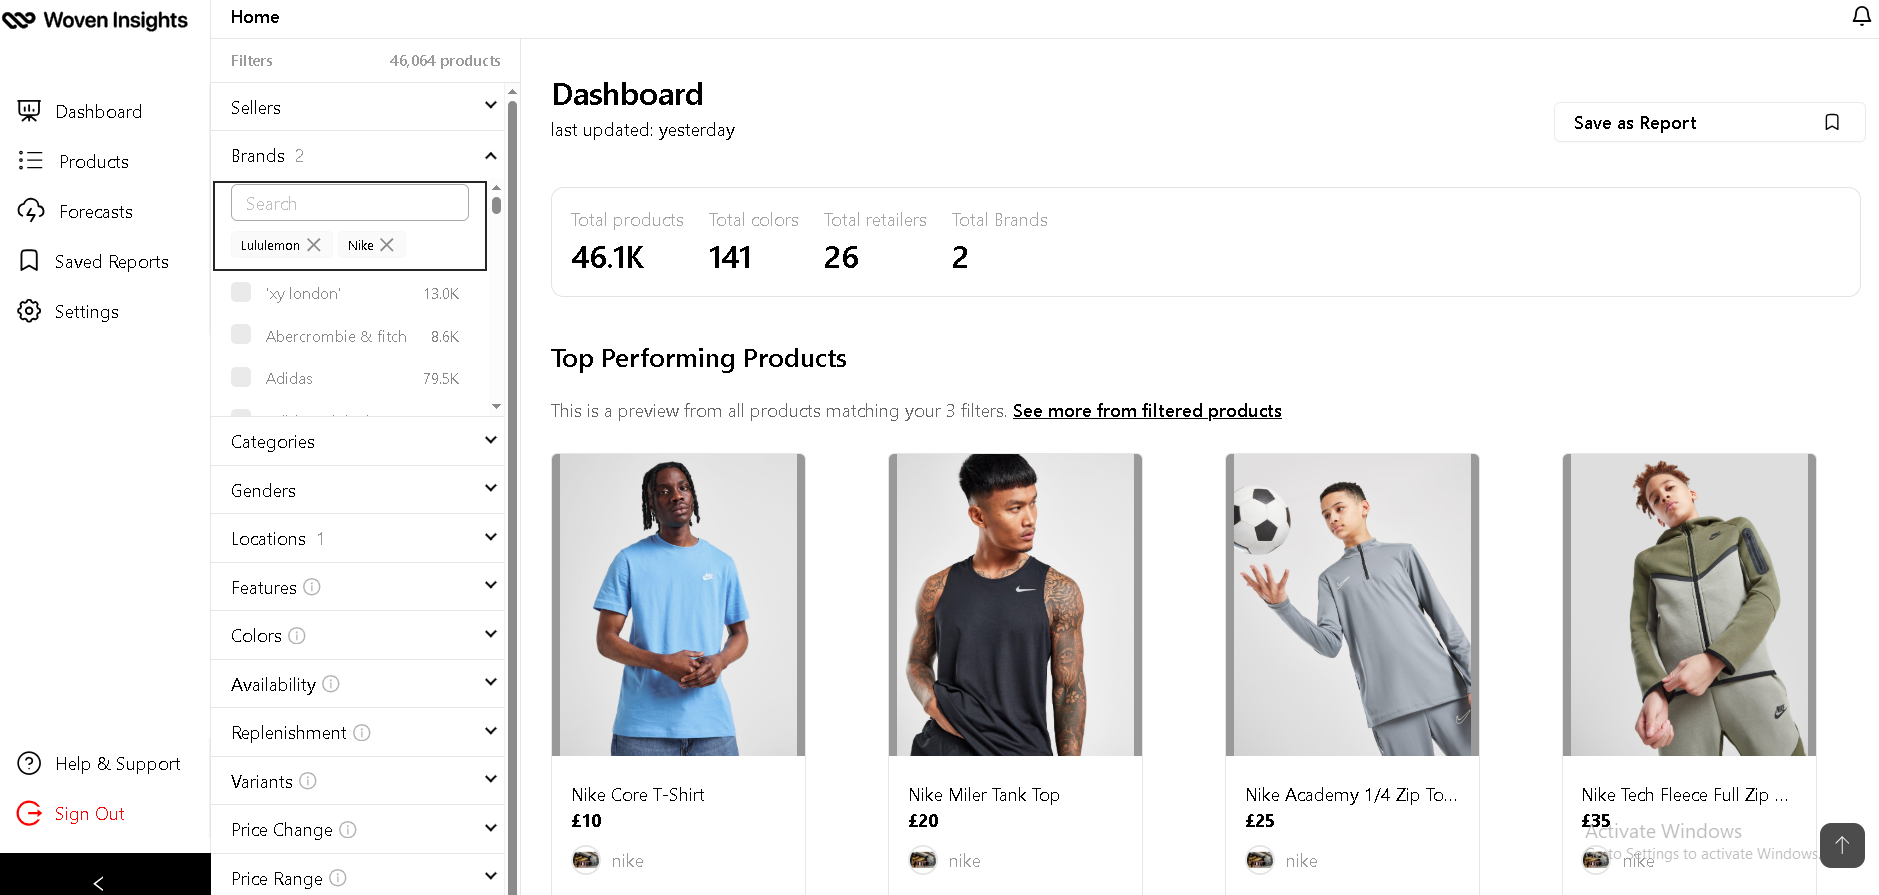
Price positioning is one of the clearest indicators of a fashion brand’s strategy and target audience. To better understand how leading activewear players approach pricing, we used Woveninsights’ Market Insights module to analyze over 46,000 products from Nike and Lululemon listed between January and May 2025.
This study covers each brand’s overall price range, most common price points, and distribution across price bands. The findings highlight how both brands align their assortments with customer spending expectations while reinforcing their unique market positions.
Overall Price Range For Nike and Lululemon
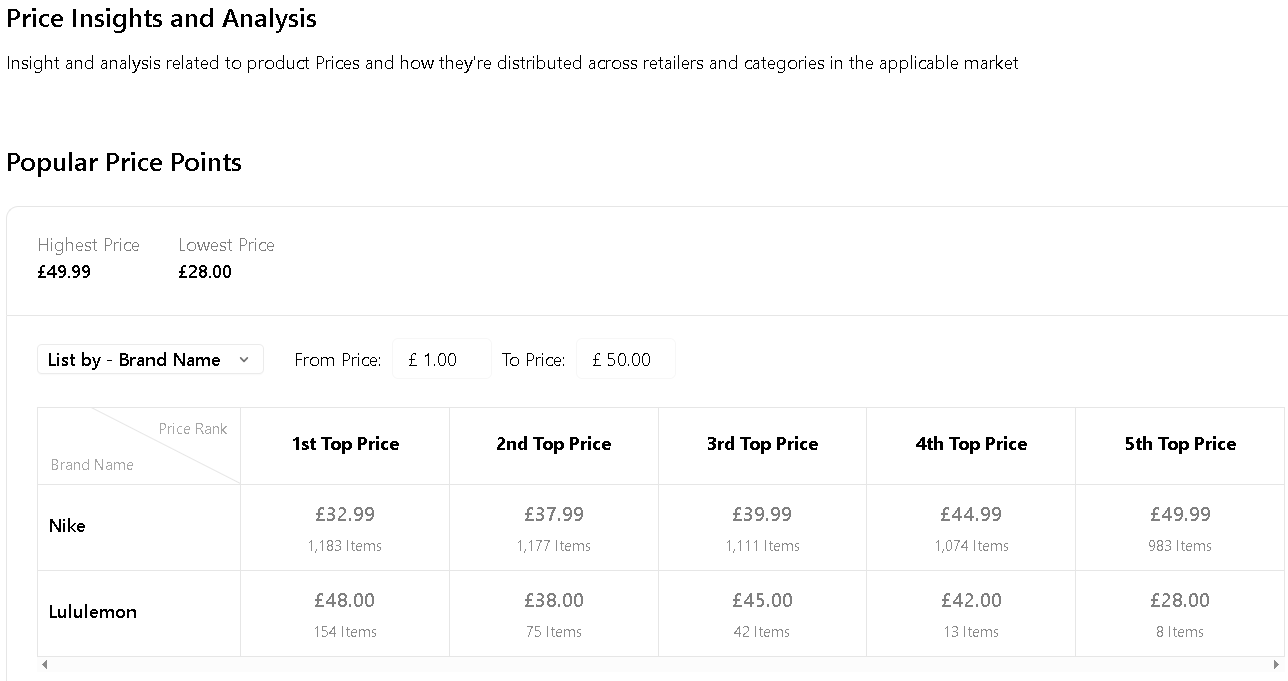
The analysis highlights the lowest and highest price points across Nike and Lululemon’s assortments, offering a clear snapshot of the brands’ pricing boundaries. Nike’s lowest price point came in at £28, while Lululemon’s highest price point reached £48, showing the range in which both brands are competitively positioned.
Top Price Points for Nike vs Lululemon
Looking closer at each brand, the data reveals the top five price points that dominate their product assortments.
For Nike, the most common price levels were £32.99, £37.99, £39.99, £44.99, and £49.99, reflecting a mid-range strategy with consistent clustering around affordable premium tiers.
For Lululemon, the leading price points were £48, £38, £45, £42, and £28, suggesting a wider spread but with a strong emphasis on higher price brackets compared to Nike.
See the chart below for a breakdown of the top five price points for each brand, along with the number of products available at those prices.
Price Band Distribution for Nike and Lululemon
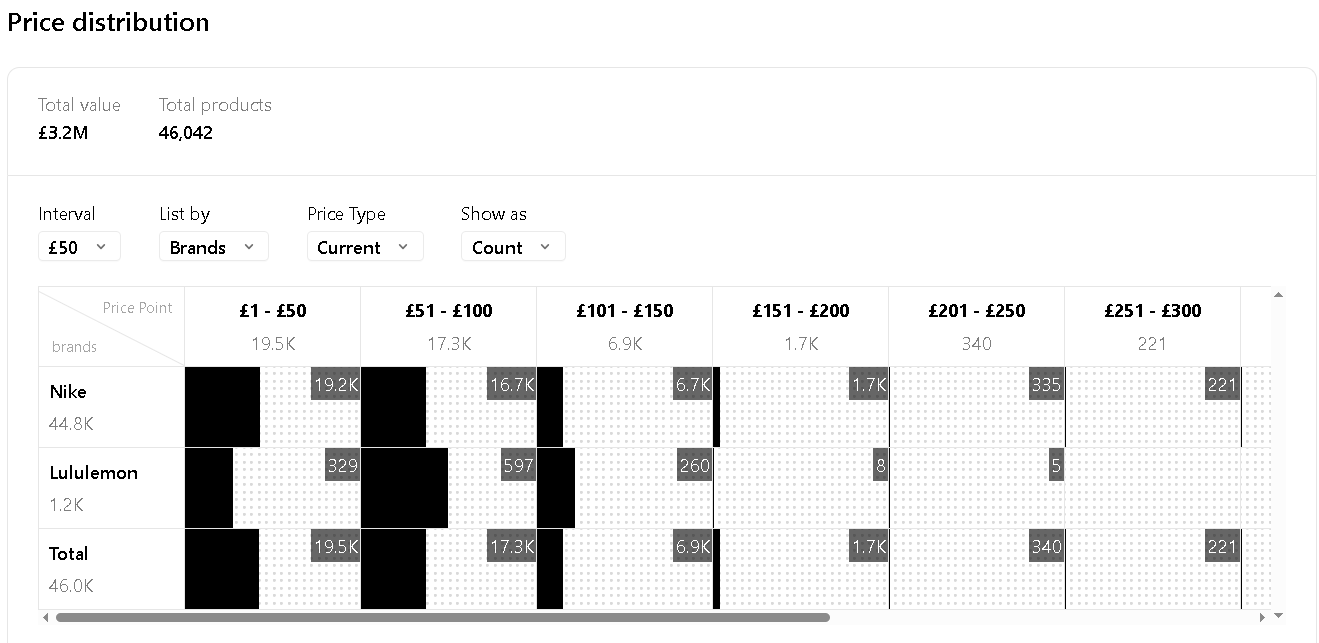
The combined value of Nike and Lululemon’s assortments during the analysis period amounted to £3.2m across all products.
For this comparison, we applied a £50 price interval, creating bands such as £1-£50, £51-£100, £101-£150, and so on.
The results show that while both brands have items across multiple bands, higher price tiers account for a much smaller share of total products, underscoring a stronger concentration in the lower to mid-price ranges. This distribution highlights how both brands balance affordability with premium positioning, but with limited representation in higher price segments.
Conclusion
The 2025 pricing analysis of Nike and Lululemon reveals two distinct yet overlapping approaches to market positioning. Both brands cluster strongly in the £1-£50 price range, signaling accessibility, but their strategies diverge in emphasis:
- Nike consolidates pricing around the mid-range, appealing to price-sensitive activewear buyers.
- Lululemon strategically anchors its assortment with both lower and higher extremes, reinforcing its premium but still accessible identity.
For fashion retailers and merchandisers, this case study highlights the value of tracking price ranges, dominant price points, and distribution trends. By benchmarking against leaders like Nike and Lululemon, brands can refine pricing strategies that balance competitiveness with brand identity.
About Woveninsights
Woveninsights is a comprehensive market analytics solution that provides fashion brands with real-time access to retail market and consumer insights, sourced from over 70 million real shoppers and 20 million analyzed fashion products. Our platform helps brands track market trends, assess competitor performance, and refine product strategies with precision.
Woveninsights provides you with all the actionable data you need to create fashion products that are truly market-ready and consumer-aligned.
Click on the Book a demo button below to get started today.
